Introduction
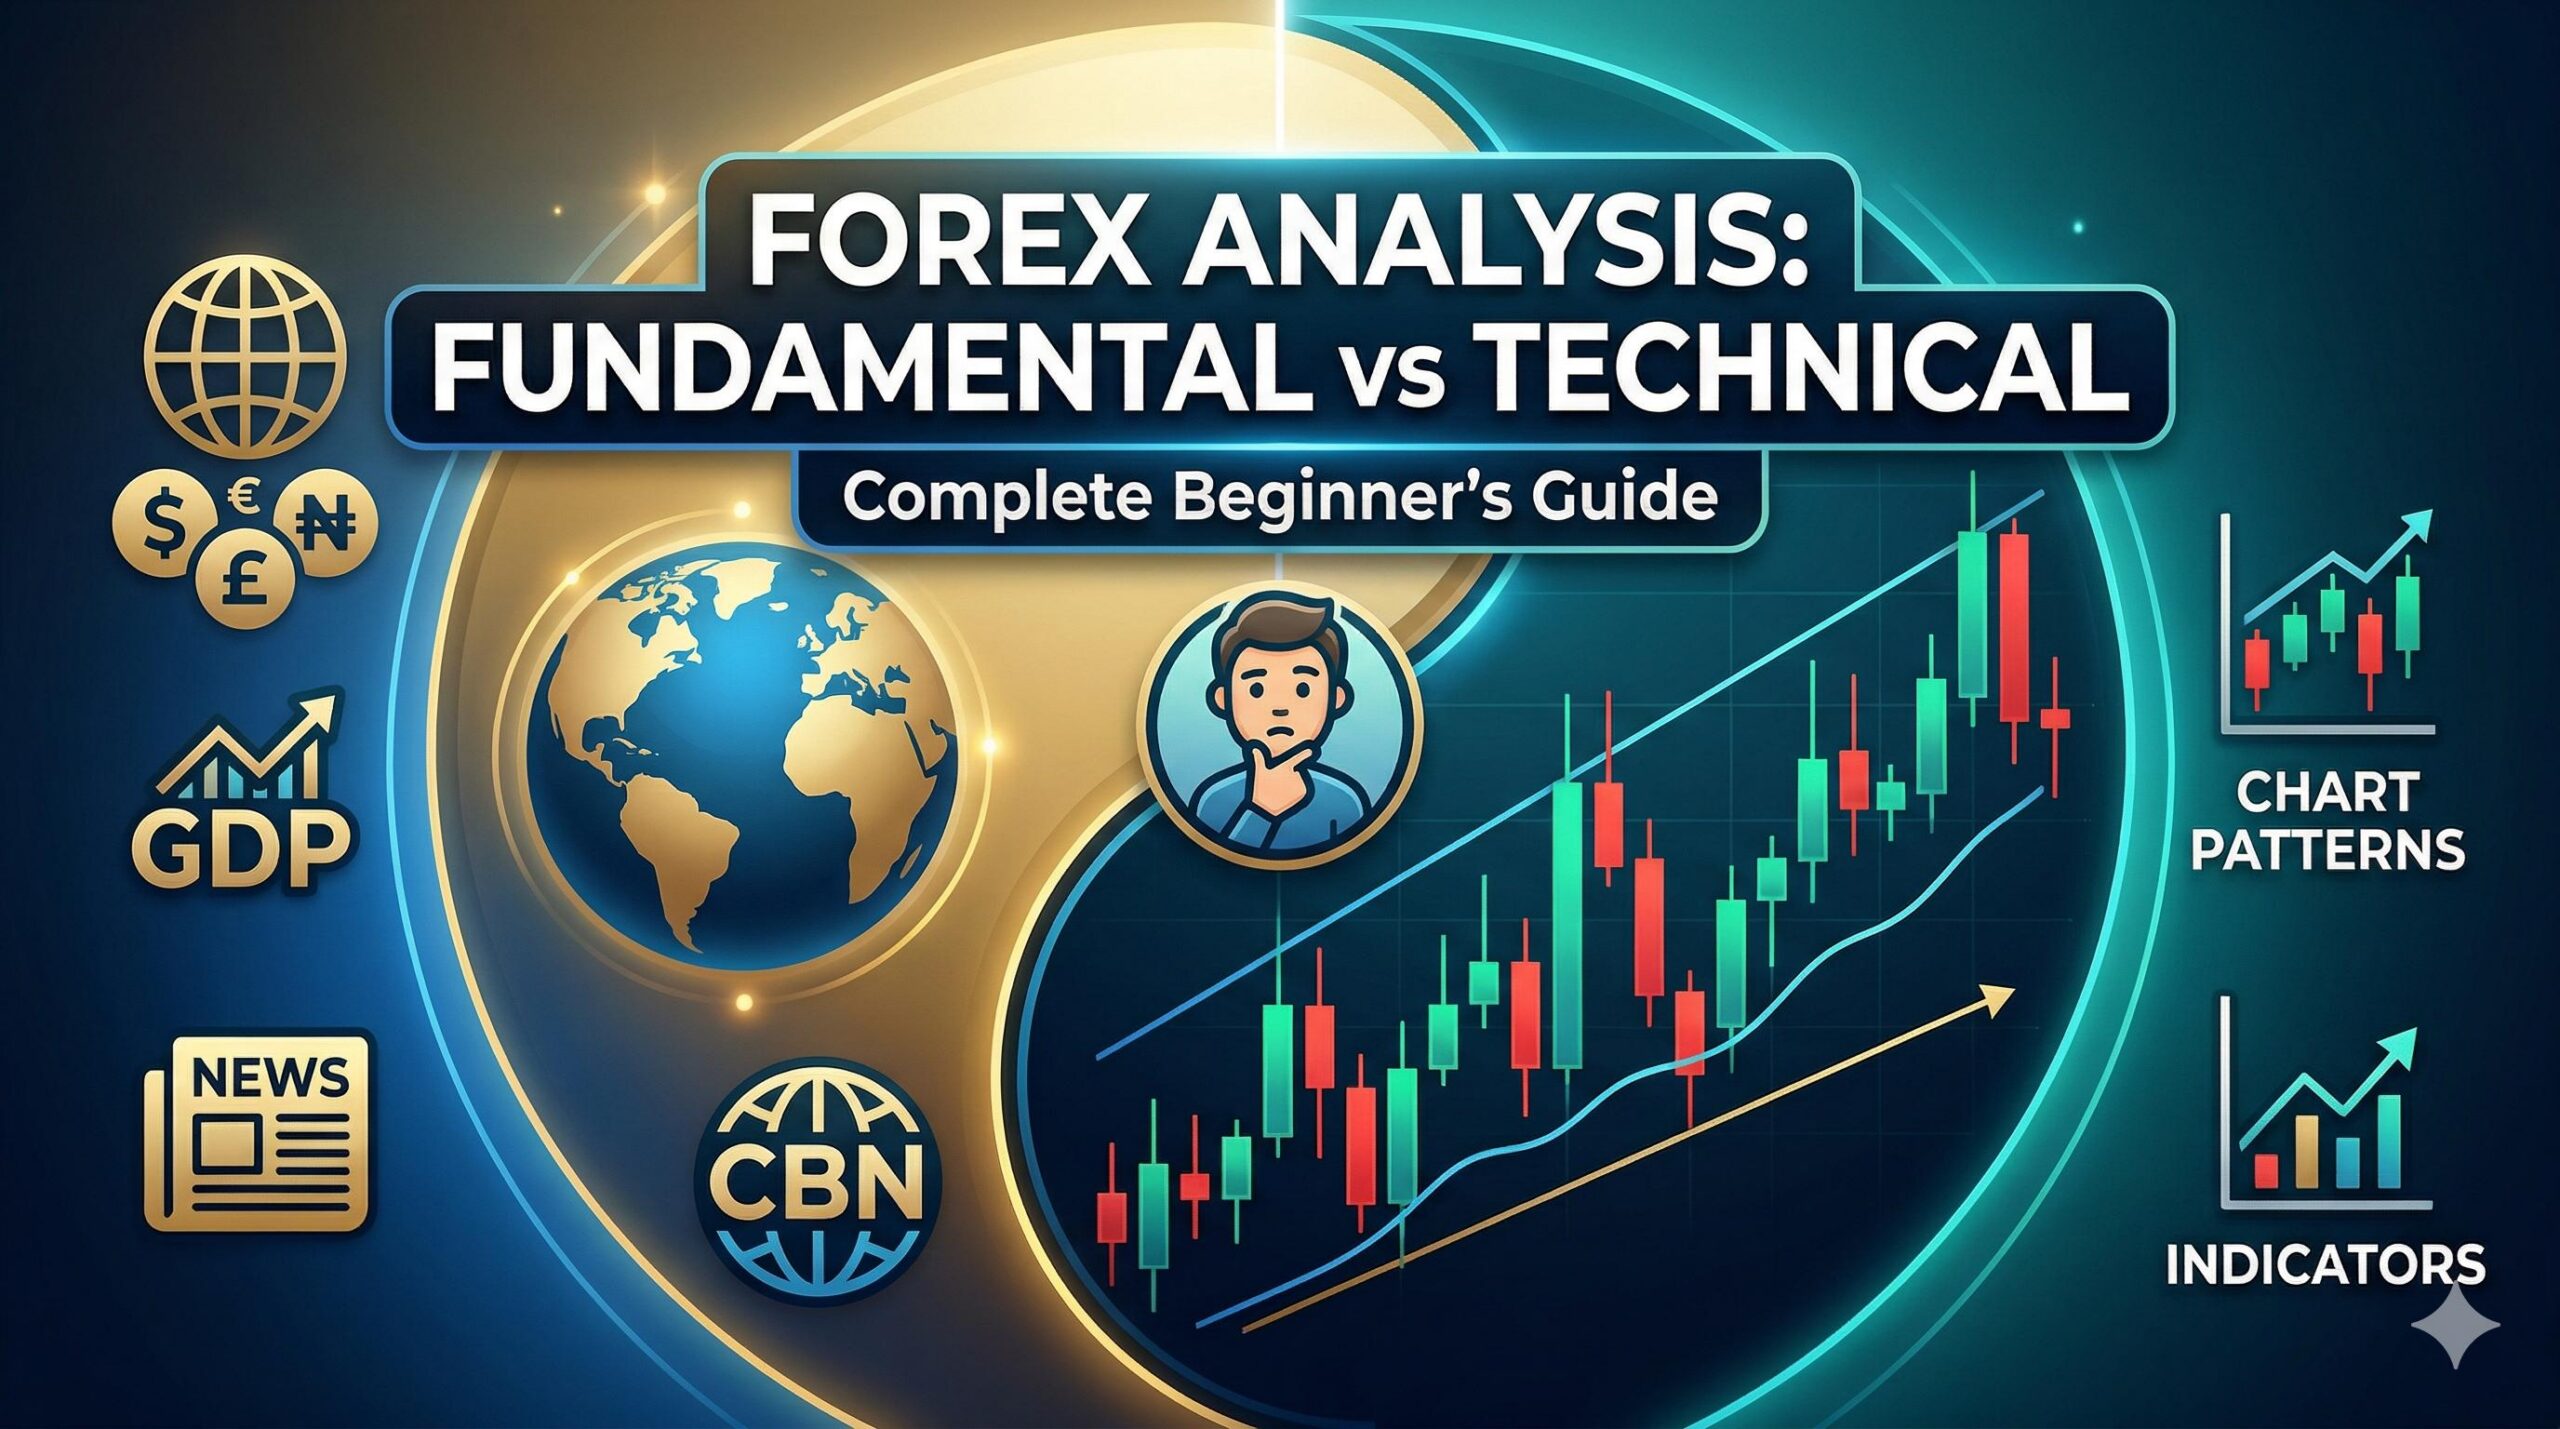
When you start learning how to trade forex, you will immediately face the core concept of fundamental analysis technical analysis. What exactly does this mean? In short, fundamental analysis technical analysis represents the two primary methods traders use to predict whether a currency’s price will go up or down.
Fundamental analysis studies the “why”—looking at real-world economic news, interest rates, and global events to determine a currency’s true value. Technical analysis studies the “what”—looking purely at historical price charts and mathematical patterns to predict future movements.

Understanding how these two distinct approaches work is your absolute first step in building a solid forex education. In this complete guide on earnfx.ng, we will break down these concepts simply so you can understand how the financial markets operate.
Important Risk Disclaimer: Trading involves significant risk. The foreign exchange market is highly volatile, and it is entirely possible to lose your invested capital. The information provided in this article by earnfx.ng is strictly for educational purposes only and does not constitute financial advice. Never trade with money you cannot afford to lose.
Table of Contents
What is Fundamental Analysis?

Fundamental analysis is the process of evaluating a country’s economic, social, and political forces to determine the intrinsic value of its currency. In the forex market, you are essentially trading the strength of one economy against another.
If a country’s economy is strong and growing, foreign investors will want to invest there. To do so, they must buy that country’s local currency, which drives up demand and increases the currency’s value. Fundamental analysts look at the macroeconomic data that proves an economy is doing well or poorly.
Key Tools of Fundamental Analysis
To practice this type of analysis, traders use an Economic Calendar. This is a schedule of when countries will release their official economic data. Key indicators include:
- Interest Rates: Set by central banks like the Central Bank of Nigeria (CBN) or the US Federal Reserve. Higher interest rates typically attract foreign investment, strengthening the currency.
- Employment Data: Such as the US Non-Farm Payrolls (NFP). If more people are working, the economy is generally healthy.
- Inflation Rates: How fast the cost of goods is rising. Central banks often change interest rates to control inflation, directly impacting currency value.
- Geopolitical Events: Elections, trade agreements, or global conflicts can cause sudden shifts in how investors view a currency’s safety.
A Beginner’s Example: If the US government announces that unemployment has dropped significantly, a fundamental analyst will deduce that the US economy is strengthening. Therefore, they might expect the US Dollar (USD) to rise in value compared to other currencies like the Euro or the Japanese Yen.
What is Technical Analysis?
While fundamental analysis looks at the real-world reasons why a currency should move, technical analysis looks at how the price is actually moving right now.

Technical analysts believe that all the fundamental news, economic data, and global events are already reflected in the current price on the chart. Therefore, they argue that you do not need to study the news; you only need to study the chart. Technical analysis involves analyzing historical price data to identify patterns, assuming that history tends to repeat itself due to human psychology.
Key Tools of Technical Analysis
Technical traders use charting platforms to look at the history of a currency pair’s price.
The most common tools include:
- Candlestick Charts: Visual representations of price movements within a specific timeframe (like 1 hour or 1 day). They show the opening, highest, lowest, and closing prices.
- Trendlines: Lines drawn on a chart to see if the overall price direction is moving up (an uptrend), moving down (a downtrend), or moving sideways (ranging).
- Support and Resistance: Think of these as invisible floors (support) and ceilings (resistance) on a chart. Support is a price level where a falling currency tends to stop falling and bounce back up. Resistance is a level where a rising currency struggles to break through and falls back down.
- Indicators: Mathematical formulas applied to price data, such as Moving Averages (which smooth out price data to show the trend clearly) or the Relative Strength Index (RSI), which helps show if a currency is “overbought” or “oversold.”
A Beginner’s Example: If a technical analyst looks at the EUR/USD chart and sees that the price has dropped to 1.0500 three times in the past month but bounced back up every single time, they identify 1.0500 as strong “support.” They might decide to buy the currency pair the next time it hits 1.0500, expecting history to repeat itself.
The Core Differences at a Glance
To truly grasp how the market works, beginners must understand how these two methodologies contrast:
| Feature | Fundamental Analysis | Technical Analysis |
| Primary Focus | The economy and “intrinsic value” (Why price moves) | Historical price charts and patterns (How price moves) |
| Main Tools | Economic calendars, news feeds, central bank reports | Candlestick charts, trendlines, mathematical indicators |
| Time Horizon | Often used for medium to long-term market views | Often used for short to medium-term trading setups |
| Core Belief | Economic health dictates future currency value | Historical price patterns will repeat themselves |
Combining Both Methods (Techno-Fundamental Trading)
")
One of the biggest misconceptions beginners face is believing they must strictly choose one method over the other. In reality, the most thorough educational approach involves combining both.
When you use the fundamental analysis technical analysis combination, you use the fundamental data to tell you what to trade, and the technical data to tell you when to trade it.
How They Work Together:
- The Fundamental View (The Direction): You read the news and see that the US economy is very strong. Your fundamental analysis tells you that you should be looking to buy the US Dollar against weaker currencies.
- The Technical View (The Entry Point): You know you want to buy the USD, but you don’t want to buy at a bad price. You open your charting platform and use technical analysis to find a strong “support” floor. You wait for the price to hit that floor before you execute your trade, giving you a safer, calculated entry point.
Price Action Trading vs Indicator Trading : A Beginner’s Guide
Frequently Asked Questions (FAQ)
1. Which is better for beginners: fundamental or technical analysis?
Neither is objectively “better,” but many beginners start with technical analysis because looking at visual charts can feel easier to grasp initially than reading complex economic reports. However, a complete education requires understanding both. You cannot safely trade a chart if you are unaware that a massive central bank interest rate announcement is happening that same day.
2. Can I use fundamental analysis technical analysis for other markets?
Yes. While this guide focuses on forex, these two analytical methods are the foundation of all financial markets. You can apply them to the stock market, commodities (like Gold and Oil), and even cryptocurrency. The specific news events will change, but the core principles of evaluating value (fundamental) and reading price action (technical) remain the same.
3. Do I need to be a math expert to use technical analysis?
No. Modern trading platforms automatically calculate complex indicators and draw charts for you. As a beginner, your job is not to do the math; your job is to learn how to visually interpret what the charts and indicators are telling you about market psychology.
4. What happens when fundamental and technical analysis disagree?
This happens frequently. A chart might look like a currency is about to rise (technical), but the economic news for that country is terrible (fundamental). When signals conflict, the safest approach for a beginner is simply to stay out of the market and wait for a clearer opportunity where both methods align.
Conclusion

The journey into forex trading is a marathon of continuous learning. By thoroughly exploring the fundamental analysis technical analysis landscape, you equip yourself with the dual lenses needed to view the financial world safely and logically.
Fundamental analysis teaches you to read the pulse of global economies, central bank policies, and geopolitical events. Technical analysis provides you with the practical, visual tools to read historical price action and pinpoint logical entry and exit zones.
While they approach the market from entirely opposite directions, learning to respect and eventually combine both methods is the hallmark of a responsible, educated trader. As a beginner in Nigeria, your immediate next step should be to open a risk-free demo account. Practice reading economic calendars and drawing lines on charts with virtual funds. Remember, the market will always be there tomorrow; prioritize your financial education and strict risk management today.