Introduction
In the rapidly expanding financial landscape of Nigeria, from the tech-savvy hubs of Lagos to the commercial centers of Kano and Onitsha, interest in the foreign exchange (forex) market is at an all-time high. As more Nigerians seek to understand the mechanics of global currency arbitrage, they inevitably encounter complex technical charts. Among the hundreds of tools available, one concept stands out as the most frequently cited entry point for new students: the RSI oversold and overbought strategy.
The Relative Strength Index (RSI), developed by J. Welles Wilder in 1978, is a momentum oscillator used to measure the speed and change of price movements. However, for a beginner, blindly following a single line on a chart is a recipe for disaster. The market is not a linear machine; it is a chaotic system of probability. A common misconception is that “oversold” means “cheap” and “overbought” means “expensive.” In reality, a strong asset can stay overbought for weeks, destroying the accounts of traders who try to sell the top too early.
 (1)")
This educational guide is designed to deconstruct the mechanics of the RSI strategy in clear, detailed English. We will move beyond the basic definitions to explain why the indicator moves, the specific dangers of “false signals” in trending markets, and how to approach forex education safely within the Nigerian regulatory context without falling for “holy grail” scams.
Table of Contents
What Is Forex Trading and the RSI?
Before diving into specific strategies, we must first define the environment in which they operate. Forex trading is the decentralized global marketplace where national currencies are exchanged against one another.
For a Nigerian business owner, forex is a utility—exchanging Naira (NGN) for US Dollars (USD) to import goods. For a retail trader, however, it is a speculative endeavor involving the analysis of economic health and price action to predict whether a currency will strengthen or weaken.
What is the RSI? To perform this analysis, traders use “Technical Indicators.” The Relative Strength Index (RSI) is a momentum oscillator.
- The Concept: It compares the magnitude of recent gains to recent losses to determine overbought or oversold conditions of an asset.
- Visual: It appears as a line graph oscillating between 0 and 100 at the bottom of your trading chart.
- The Math (Simplified): If the price has closed higher for 14 days in a row, the RSI will be near 100. If it has closed lower for 14 days, it will be near 0. It is essentially a speedometer for price.
How the RSI Oversold and Overbought Strategy Works

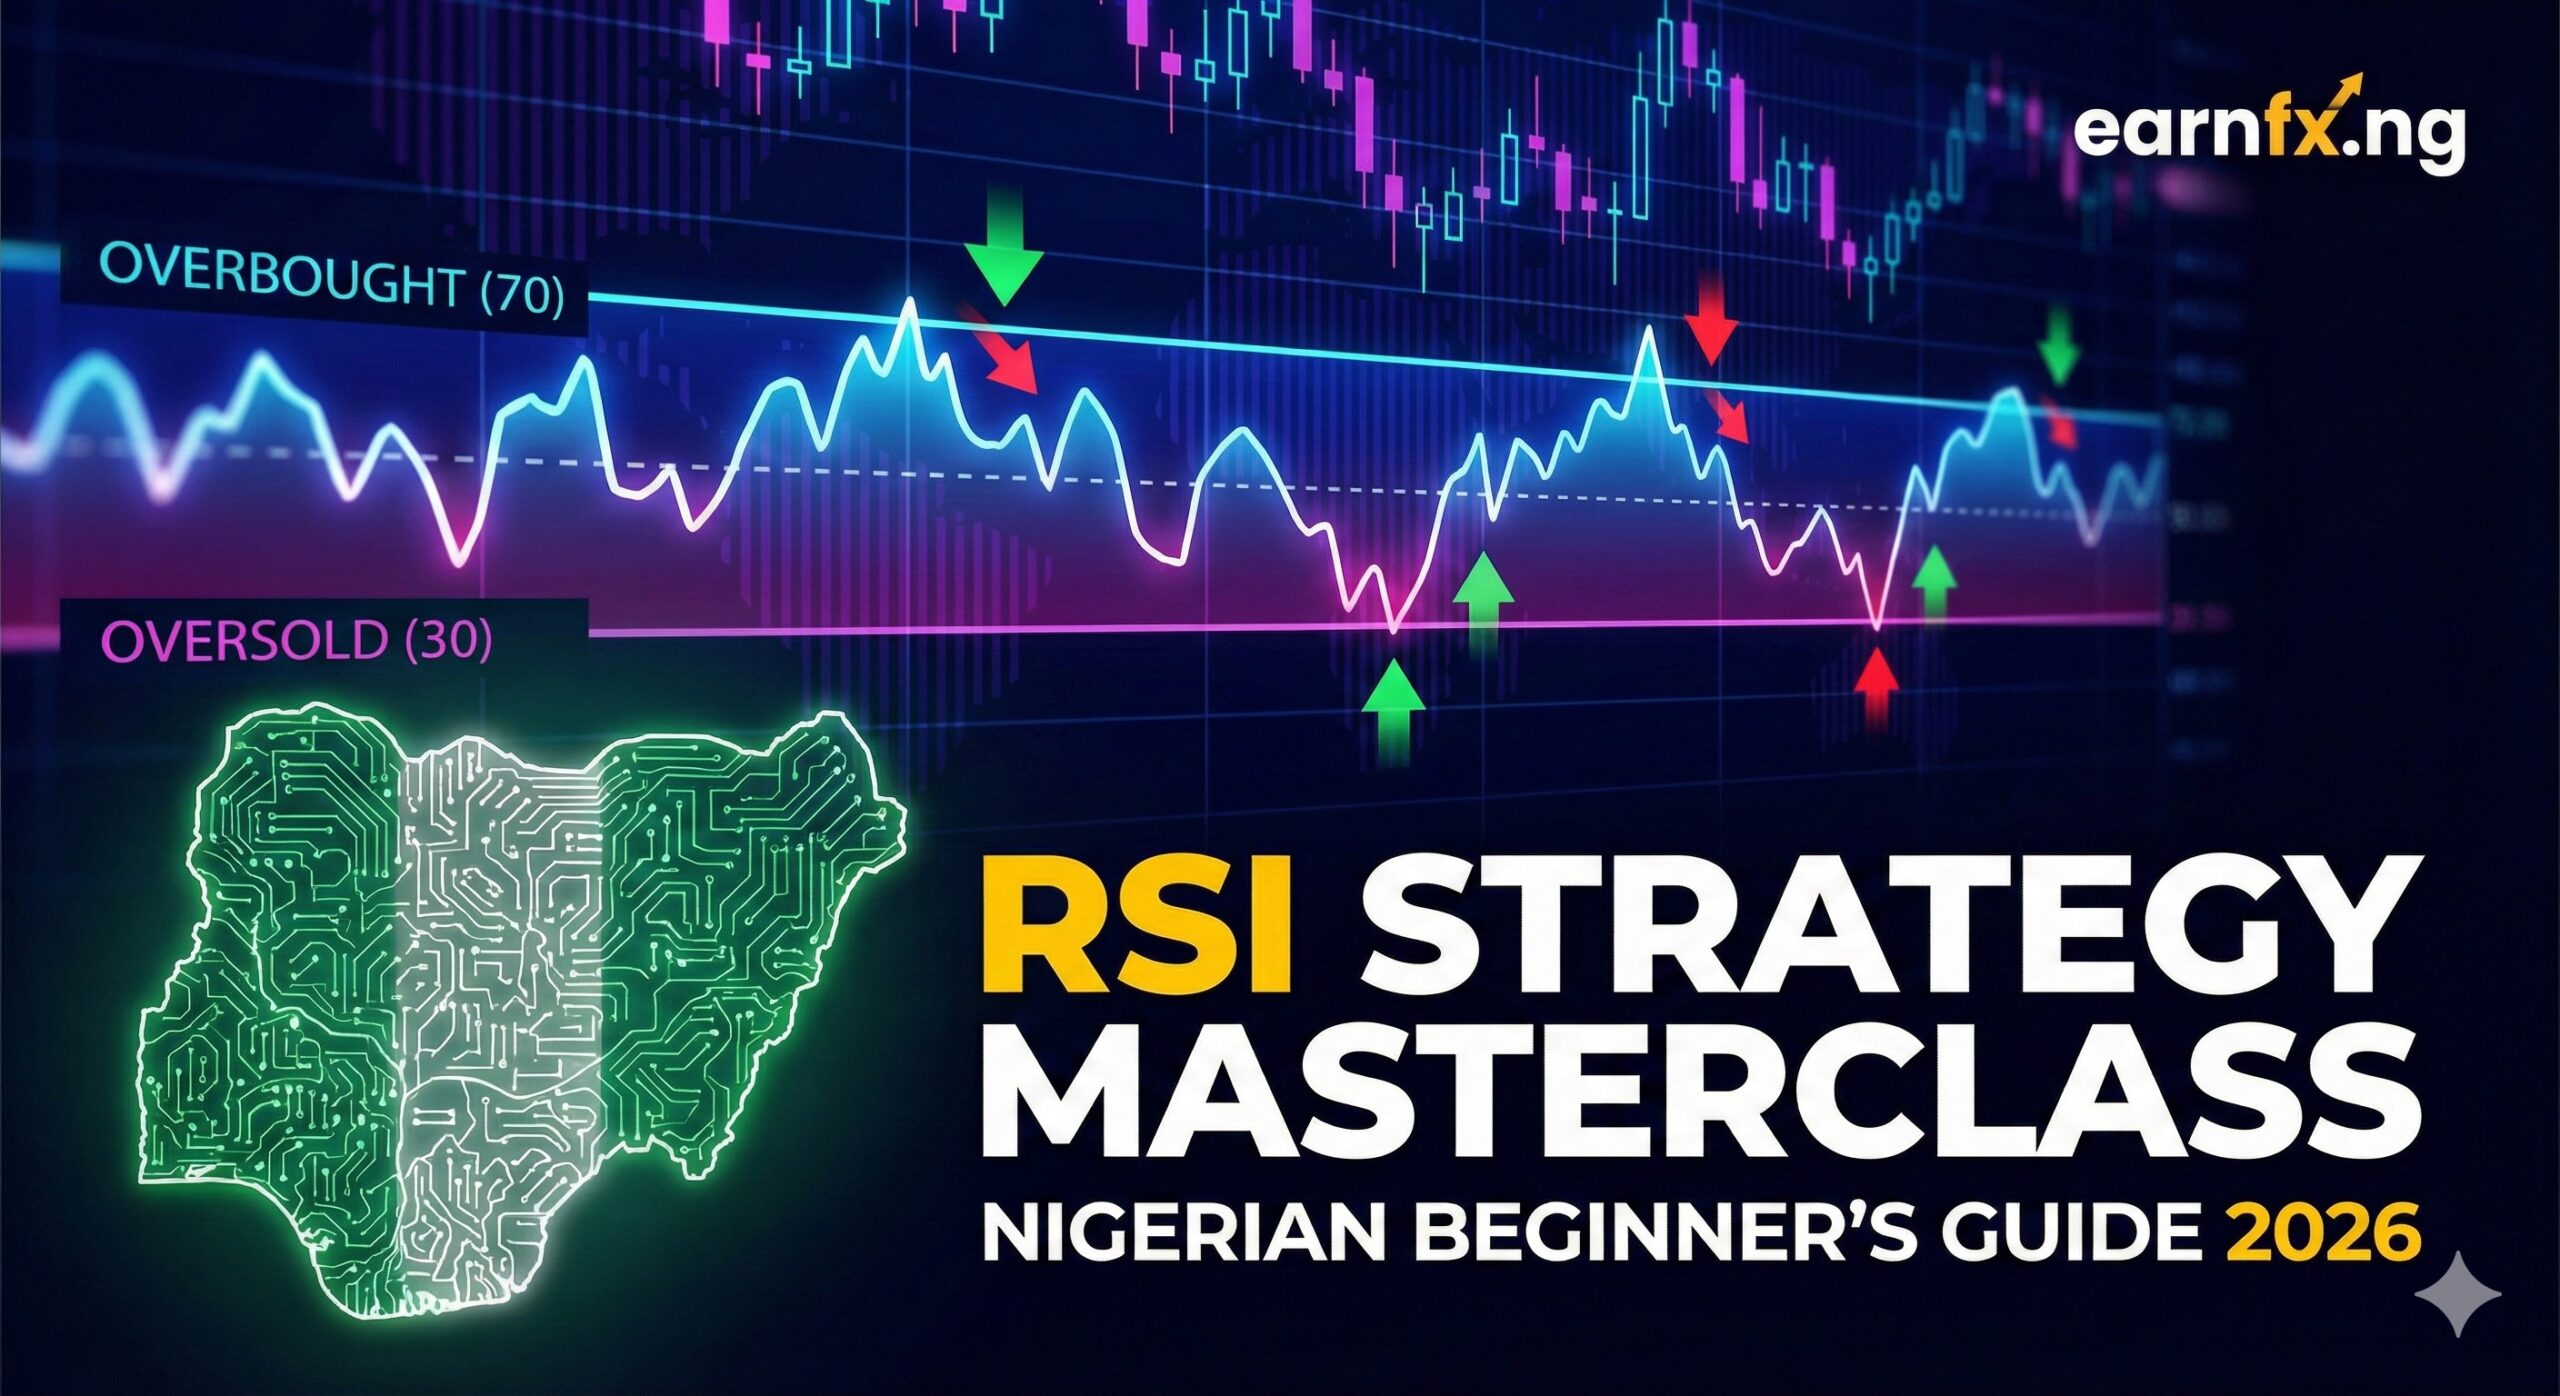
The core of the strategy relies on identifying extremes. The RSI scale uses two critical threshold levels: 30 and 70.
1. The “Overbought” Signal (Level 70)
When the RSI line crosses above the 70 mark, the market is technically considered “overbought.”
- The Theory: This indicates that buying momentum has been aggressive and potentially unsustainable in the short term. The asset may be “extended” and due for a pullback (price drop) or consolidation (sideways movement).
- The Strategy: Educational theory suggests looking for Sell entries only after the RSI peaks above 70 and then crosses back below 70. This confirmation is crucial.
2. The “Oversold” Signal (Level 30)
When the RSI line drops below the 30 mark, the market is technically considered “oversold.”
- The Theory: This suggests that selling pressure has been intense and sellers may be exhausted. The price might be due to bounce back up as profit-taking occurs.
- The Strategy: Theory suggests looking for Buy entries only after the RSI dips below 30 and then crosses back above 30.
3. Advanced Concept: RSI Divergence
A more reliable signal often taught in advanced courses is Divergence.
- Bullish Divergence: The price makes a lower low (looks weak), but the RSI makes a higher low (momentum is shifting up). This suggests the sellers are losing power, even if the price is still dropping.
- Bearish Divergence: The price makes a higher high, but the RSI makes a lower high. This suggests buyers are running out of steam.
Is Forex Trading Legal in Nigeria?
A common question for beginners engaging with these strategies is regarding legality.
Legal Status: Yes, forex trading is legal in Nigeria. There is no legislation prohibiting a Nigerian citizen from analyzing charts, using indicators like RSI, and opening an account with an international broker.
Regulatory Context: However, the landscape is nuanced. The Central Bank of Nigeria (CBN) strictly regulates traditional banking and the official FX windows (like the I&E window). The online retail forex sector operates in a “regulatory grey zone.”
- No Local Licenses: Currently, the Nigerian SEC does not issue licenses to online retail forex brokers.
- Offshore Reliance: Consequently, most legitimate brokers available to Nigerians are “offshore” entities.
- Safety Implication: Because no local government body protects your funds if an offshore broker fails, Nigerian traders must rigorously select brokers regulated by top-tier foreign bodies like the FCA (UK), ASIC (Australia), or FSCA (South Africa).
Common Risks of the RSI Strategy (IMPORTANT)

This is the most critical section for your safety. The RSI is a mathematical tool, not a crystal ball.
1. The “False Signal” Trap in Trends
The biggest killer of beginner accounts is the “Trending Market.”
- Scenario: Imagine the US Dollar is strengthening rapidly against the Naira due to an economic crisis. The chart shows a strong Uptrend.
- The Trap: The RSI will hit 70 (Overbought). You sell. The price keeps going up. The RSI hits 80. You sell more. The price goes higher. The RSI hits 90. You blow your account.
- The Lesson: In a strong trend, the RSI can stay “Overbought” or “Oversold” for days or weeks. Never trade against a strong trend just because of the RSI.
2. Lagging Nature
The RSI is calculated based on past candles (usually the last 14). It cannot predict the future. If the CBN announces a new policy regarding the Naira tomorrow, the price will move instantly, and the RSI will be irrelevant until it “catches up.”
3. Lack of Context
RSI ignores fundamental data. It doesn’t know if a war just started or if interest rates changed. It only knows math. Relying on it in isolation leaves you blind to the real-world events driving the price.
Beginner Mistakes Nigerians Should Avoid
To protect your capital, avoid these common errors:
- Trading RSI in Isolation: Never enter a trade only because the line crossed 30 or 70. You must look for “Confluence”—is the price also at a Support level? Is there a Candlestick pattern?
- Ignoring the “50” Level: In a strong Bull market (uptrend), the RSI often stays between 40 and 90. It rarely drops to 30. Waiting for 30 in a Bull market means you will miss the entire move. In strong trends, the 50 level often acts as support.
- Martingale Trading: When the RSI goes against you (e.g., you buy at 30, but it drops to 20), do not keep adding more trades to “average down.” This is gambling, not trading.
- Using Default Settings Blindly: The standard RSI setting is 14 periods. While good, some traders adjust this to 7 (faster signals, more false alarms) or 21 (slower signals, fewer false alarms) depending on their style.
Learning Technical Analysis the Right Way
If you want to understand the RSI strategy properly, follow an education-first approach.
1. The Demo Account Phase
Do not risk real Naira to test a strategy.
- Open a free Demo Account with a reputable broker.
- Apply the RSI indicator.
- Trade only based on RSI signals for 3 months.
- Goal: Document how many times the signal worked versus how many times it failed. This “Backtesting” builds realistic expectations.
2. Study Market Structure
RSI works best in “Ranging Markets” (when price is bouncing sideways between two levels). It performs poorly in “Trending Markets.” Your first job is to identify if the market is ranging or trending, then decide if you should use the RSI.
3. Risk Management First
Even the best RSI setup can fail. You must always use a Stop Loss (an automatic exit order) to protect your account. A common rule is never to risk more than 1-2% of your account on a single trade.
How to Stay Safe From Forex Scams in Nigeria
The complexity of indicators like RSI creates an opportunity for scammers to confuse and defraud beginners.
- “Magic Indicator” Sellers: Be extremely wary of vendors on Telegram or WhatsApp selling “Modified RSI” tools that “never repaint” or “never lose.” There is no such thing as a 100% accurate indicator.
- Signal Groups: Scammers often claim to have a “secret strategy” and ask you to pay a subscription for signals. Legitimate trading is about developing your skill, not becoming dependent on a stranger.
- Investment Schemes: If a platform claims they use a “High-Frequency RSI Bot” to generate guaranteed daily returns (e.g., 20% per week), it is a Ponzi scheme. Legitimate trading involves losses and variable returns.
Frequently Asked Questions (FAQs)
1. Is the RSI strategy reliable for beginners? It is a useful educational tool for learning market momentum, but it is not reliable on its own. It generates many false signals. It must be combined with Price Action analysis (Support/Resistance) to be effective.
2. What is the best timeframe for RSI? There is no “best” timeframe, but higher timeframes (Daily, 4-Hour) are generally considered more reliable than lower timeframes (1-Minute, 5-Minute). Lower timeframes have more “noise” and false signals.
3. Is forex trading safe in Nigeria? Forex trading carries a high risk of financial loss. While the activity is legal, the market is volatile. Safety comes from education, using strictly regulated brokers, and never trading with money you need for essential living expenses.
4. Can RSI predict market crashes? No. RSI is a “lagging” indicator. It reflects what price has done, not what it will do. While “Divergence” can sometimes hint at a reversal, it is not a prediction tool for specific events.
5. How much money do I need to test this strategy? You need Zero Naira. You should test this strategy exclusively on a Demo Account with virtual funds until you fully understand the mechanics and risks.
6. Are forex profits guaranteed? Absolutely not. Most retail traders lose money. Any individual or company promising guaranteed profits is violating honest trading principles and is likely a scam.
Conclusion
The RSI oversold and overbought strategy is a foundational concept in technical analysis that can help Nigerian beginners understand the ebb and flow of market momentum. By identifying potential exhaustion points at levels 30 and 70, students of the market can visualize the tug-of-war between buyers and sellers.
However, a chart is not a bank account. Understanding the RSI is merely the first step in a marathon of learning. The forex market is unforgiving of those who rely on simple indicators without understanding market context, trend strength, and strict risk management.
We strongly encourage you to prioritize education. Use demo accounts to observe the RSI in action without financial risk, read widely on market structure, and treat trading as a disciplined profession rather than a gamble.
Risk Warning & Disclaimer: For Educational Purposes Only: The content provided in this article and on earnfx.ng is strictly for educational and informational purposes. It does not constitute financial, investment, or trading advice. High Risk Involved: Forex trading involves a significant level of risk and may not be suitable for all investors. Technical indicators like the RSI are not guaranteed to predict market movements. You should never invest money you cannot afford to lose. No Guarantees: Past performance of any strategy is not indicative of future results. We strongly recommend conducting your own research.